
Last updated:
HMA Wealth may earn a commission if you sign up through some links on this page. This does not affect our recommendations. See our Disclaimer for details.
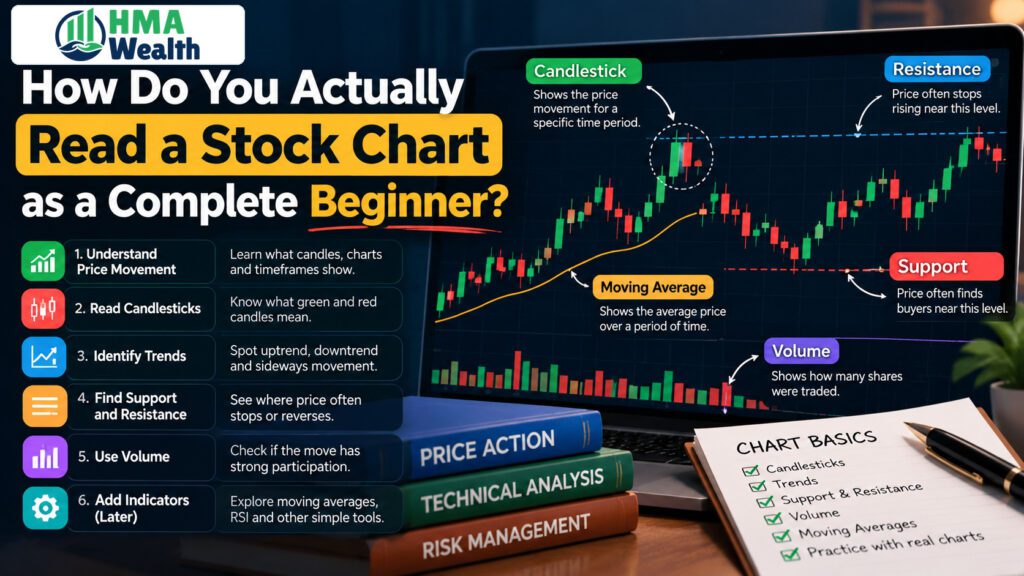
Table of Contents
The first time I opened a stock chart on a broker’s app, I genuinely thought something had broken. Red and green candle-shaped blocks everywhere, a jagged line underneath labeled “volume,” and a handful of squiggly lines crossing through all of it. I closed the app and bought the stock anyway, purely on a friend’s tip. It went nowhere for eight months, and only later did I realize the chart had been telling me exactly that the whole time, if I’d known how to read a stock chart in the first place.
That’s the gap HMA Wealth keeps running into with new investors. People open a Demat account, download a trading app, and stare at a chart that looks like a foreign language, so they skip straight to tips and headlines instead. This guide is the one I wish someone had handed me that first week.
What Are You Actually Looking At When You Open a Stock Chart for the First Time?
At its core, a stock chart is just price plotted against time. The vertical axis shows the price, the horizontal axis shows the date or time, and everything else, candles, lines, indicators, is built on top of that one simple relationship.
Before anything else makes sense, get comfortable with the basics: the stock’s last traded price, its percentage change for the day, the day’s high and low, and its 52-week high and low. These numbers usually sit right above or beside the chart itself, and they give you context before you even look at the shapes. If you haven’t opened a Demat account yet, that’s worth sorting out first, since you’ll need one before any of this becomes more than theory.
Our broader guide on what the stock market actually is is worth reading first if even these basics feel unfamiliar, since chart reading assumes you already know what a share price represents.
What Do the Candlesticks on a Chart Actually Mean?
This is usually where beginners freeze, so it’s worth slowing down. Each candlestick represents one time period, a day, an hour, five minutes, whatever interval you’ve selected, and shows four prices for that period: the open, the high, the low, and the close.
The thick part of the candle, called the body, shows the gap between the open and close. A green (or sometimes white) body means the close was higher than the open; a red (or sometimes black) body means the close was lower. The thin lines above and below the body, called wicks or shadows, show the highest and lowest prices touched during that period.
A long green body tells you buyers were firmly in control that period. A small body with long wicks on both ends tells you the price swung around a lot but ended up roughly where it started, often a sign of indecision. Learning to read how to read a stock chart really starts with learning to read individual candles, since every pattern and trend on the chart is just a sequence of these candles strung together.
What’s the Difference Between a Line Chart, Bar Chart, and Candlestick Chart?
A line chart is the simplest version; it connects closing prices across periods with a single continuous line, stripping away the open, high, and low entirely. It’s useful for spotting a broad trend at a glance but hides a lot of detail.
A bar chart shows the same open-high-low-close data as a candlestick but as small vertical bars with tick marks instead of filled bodies, less visually intuitive for most beginners.
A candlestick chart is the one most Indian traders and investors default to, because the colored bodies make it genuinely faster to read sentiment at a glance than either alternative. For context on how technical tools like these differ from simply evaluating a company’s business, our piece on fundamental versus technical analysis is a useful companion read. If you’re also tracking a broader index rather than a single stock, our guide on understanding market indices explains how those charts are built from hundreds of individual stocks at once.
How Do You Read the Time Frame Correctly?
This is one of the most overlooked parts of learning how to read a stock chart, and it’s also where a lot of beginners get misled. The same stock can look like it’s crashing on a 1-day chart and look perfectly healthy on a 1-year chart, because each candle on the 1-day view represents a few minutes, while each candle on the 1-year view might represent a full week.
As a rule, check at least a 6-month to 1-year chart before forming any opinion about a stock, since short-term price swings on a 5-minute or 1-day chart can be genuinely misleading if you mistake normal volatility for a real trend change. Our comprehensive stock market guide for beginners covers this same point in more depth, along with the broader basics of how price data gets displayed.
Longer timeframes suit long-term investors; shorter timeframes matter more to intraday and swing traders. If you’re still deciding which trading style fits you, our breakdown of which type of trading is best for beginners is worth reading before you commit to watching any particular timeframe obsessively.
Long-term investors who’d rather avoid picking individual stocks altogether might also compare charts of ETFs, which track an entire index rather than a single company’s price swings.
What Is Volume, and Why Does It Matter as Much as Price?
Volume is the number of shares traded during a given period, usually shown as a bar chart sitting right below the price chart. It’s easy to ignore, but it’s arguably as important as the price movement itself.
A price rise on unusually high volume suggests genuine, broad-based buying interest. The same price rise on thin volume could just be a handful of trades nudging the price up, far less convincing as a signal.
Checking volume alongside price is one of the simplest habits that separates a casual chart-glancer from someone who’s actually learning how to read a stock chart properly. This same logic applies to IPO listings too, where early trading volume often says more about genuine investor interest than the listing-day price pop alone.
What Are Support and Resistance, and How Do You Spot Them on a Chart?
Support is a price level where a stock has historically stopped falling and bounced back up, as if there’s a floor beneath it. Resistance is the opposite, a price level where the stock has repeatedly struggled to rise above, as if there’s a ceiling.
You spot these by looking for price levels the stock has touched and reversed from multiple times on the chart, not just once. A single bounce could be coincidence; three or four bounces off roughly the same level is a genuine pattern worth noting.
These levels matter practically too. Many traders set their stop-loss just below a support level rather than at an arbitrary price, since a break below support often signals the trend has genuinely shifted.
Our explainer on the golden rule for stop-loss covers how to decide your exit point before you even enter a trade, which pairs naturally with identifying these levels on a chart first. HMA Wealth generally recommends identifying at least two support and resistance levels before entering any trade, not just the nearest one.
What’s a Trend Line, and How Do You Draw One Correctly?
A trend line is a straight line connecting at least two, ideally three or more, points where the price has touched a rising or falling boundary. An uptrend line connects a series of rising lows; a downtrend line connects a series of falling highs.
The mistake most beginners make is forcing a trend line to fit a story they already believe, rather than letting the actual price points define it. A trend line drawn through only two points is a guess; one confirmed by a third touch is considerably more reliable. Our guide on CAGR is worth a look too if you want to measure a trend’s actual strength in percentage terms rather than relying on how steep a line looks on screen.
What Do Moving Averages Actually Tell You?
A moving average smooths out daily price noise by plotting the average closing price over a set number of periods, commonly 50 days or 200 days, as a single flowing line overlaid on the chart. It tells you the general direction of the trend without the distraction of every single day’s up-and-down movement.
When the price trades above its moving average, that’s generally read as a sign of an uptrend; below it, a downtrend. When a shorter moving average crosses above a longer one, often called a golden cross, it’s frequently read as a bullish signal, and the reverse, a death cross, as bearish.
These crossovers don’t assure future direction, they’re just one input among several that technical traders weigh together.
What Is RSI, and How Do Beginners Misread It?
The Relative Strength Index (RSI) is a momentum indicator, typically plotted on a scale of 0 to 100, that measures how quickly and sharply a stock’s price has moved recently. A reading above 70 is generally considered “overbought,” and below 30, “oversold.”
The common beginner mistake is treating these as automatic buy or sell signals. A stock can stay “overbought” for weeks during a genuinely strong rally, and treating 70 as an automatic sell signal can mean exiting a winning position far too early.
RSI works best as one confirming input alongside price action and volume, not a standalone trigger. Learning how to read a stock chart properly means treating every indicator this way, as one vote among several rather than a single deciding factor.
Our guide on types of mutual funds is a useful detour here too, since debt and equity funds each carry very different chart behaviour worth recognising on sight.
How Does Technical Analysis Differ From Just Reading the Company’s Fundamentals?
Everything covered so far, candles, support and resistance, moving averages, RSI, falls under technical analysis: studying price and volume patterns rather than the underlying business. Fundamental analysis, by contrast, looks at a company’s earnings, debt, management quality, and growth prospects to estimate what the business is actually worth.
Neither approach alone tells the full story. Fundamentals can help you decide what to buy; chart reading can help you decide when to buy or sell it.
If you’re also building out the fundamentals side of your research process, our guide on how to start investing is a reasonable next step once the basics of chart reading feel comfortable. Our broader explainer on common investing mistakes covers several that apply equally to chart-reading beginners, like over-relying on a single indicator.
At HMA Wealth, we treat chart reading as a skill that supports a broader investing plan, not a shortcut around understanding what you actually own. Pairing it with a solid grasp of mutual funds for beginners gives you a fuller toolkit than charts alone ever will.
What Mistakes Do Beginners Make When Reading Charts for the First Time?
- Staring only at the shortest timeframe available, mistaking normal intraday noise for a meaningful trend
- Treating a single candle or crossover as a certain signal, rather than one data point among several
- Ignoring volume entirely, missing whether a price move actually has real conviction behind it
- Forcing a trend line to match a conclusion already formed, instead of letting the actual price points define it
- Jumping into technical analysis before understanding what a share or an index even represents, which makes every pattern feel more mysterious than it needs to be
Our guide on what equity actually means is a good starting point if that last mistake sounds familiar, since chart patterns make far more sense once the underlying instrument itself is clear.
How Do You Actually Practice Reading Charts Without Risking Real Money?
- Open a free charting tool or your broker’s app and pick two or three stocks you already know something about, rather than random unfamiliar names.
- Switch between timeframes on the same stock, 1-day, 1-month, 1-year, and notice how differently the same price action reads at each one.
- Mark the support and resistance levels you spot, then check back over the following weeks to see whether the price actually respected them.
- Add a 50-day or 200-day moving average to the chart and observe how the price behaves around it over a few months, without acting on it yet.
- Keep a simple notebook or spreadsheet of what you expected a chart to do and what actually happened, since this feedback loop is how chart reading genuinely improves over time, far more than reading theory alone.
If you’re pairing this with learning how to actually place a trade once you’re ready, our explainer on how to place an intraday order and our broader guide on choosing a broker in India are worth reading once chart basics feel settled.
Understanding the role a broker actually plays also helps, since the charting tools you’ll practice on usually come built into your broker’s own platform. Make sure you also have a proper trading account set up alongside your Demat account before you start practicing with live prices.
It’s also worth knowing that individual stocks carry daily price limits. Our explainer on upper circuit and lower circuit covers how exchanges cap single-day price moves, which occasionally explains a chart pattern that would otherwise look strange.
HMA Wealth built this guide because chart reading is one of those skills that looks intimidating purely because nobody breaks it down candle by candle, and once you’ve actually practiced on a handful of real charts, the shapes stop looking random and start looking like information. Once you’re comfortable, our guide on building wealth over the long term shows how chart reading fits into a bigger plan rather than standing alone as a strategy by itself.
This article is educational content meant to help you understand how to read a stock chart, not personalised investment advice. Technical analysis is a tool for timing decisions, not a promise of future price movement, and past chart patterns don’t assure future results. Always do your own research and consult a SEBI-registered investment adviser before making a specific buy or sell decision.
At the end of the day, learning how to read a stock chart isn’t about memorizing every indicator or pattern that exists. It’s about building the habit of actually looking, checking the timeframe, the volume, and the levels, before reacting to a single candle or a friend’s tip, which is exactly the habit I wish I’d built before that first, entirely avoidable eight-month wait.
FAQs — How Do You Actually Read a Stock Chart as a Complete Beginner?
What’s the first thing I should learn about how to read a stock chart?
Start with the basics: price on the vertical axis, time on the horizontal axis, plus the last traded price and day’s high/low shown beside the chart. Once that’s comfortable, move on to candlesticks, since nearly everything else on the chart builds on them.
How to read a stock chart candlestick correctly?
Each candle shows the open, high, low, and close for one time period. A green body means the close was higher than the open; red means lower, and the thin wicks above and below show the extremes touched during that period.
Does learning how to read a stock chart require expensive tools?
No. Most broker apps and free charting platforms already include candlesticks, volume, moving averages, and RSI built in. You don’t need paid software to start practicing the basics covered in this guide.
What timeframe should a beginner use when learning how to read a stock chart?
Start with a 6-month to 1-year view rather than a 1-day or 5-minute chart, since short-term price swings can look far more dramatic than they actually are. Shorter timeframes matter more once you’ve moved into intraday or swing trading specifically.
Can how to read a stock chart replace fundamental analysis entirely?
No. Chart reading helps with timing entries and exits, while fundamental analysis tells you whether a company is actually worth owning in the first place. Most experienced investors use both together rather than relying on either alone.